Little Wea Creek Survey
Little Wea Creek at County Road 800 South, Tippecanoe County, Indiana
Survey Results

Temperature
Temperature can determine the form, solubility, and toxicity of a broad range of aqueous compounds. Likewise, water temperature regulates the species composition and activity of life associated with the aquatic environment. Since essentially all aquatic organisms are cold-blooded, the temperature of the water regulates their metabolism and ability to survive and reproduce effectively (USEPA, 1976). The Indiana Administrative Code (327 IAC 2-16) sets maximum temperature limits to protect aquatic life for Indiana streams. For example, temperatures during the months of June and July should not exceed 90oF by more than 3oF. The code also states that the “maximum temperature rise at any time or place… shall not exceed 5oF in streams…”
Seasonal changes in temperature create major differences in temperature throughout the sampling period. In Little Wea Creek, temperatures ranged from 0.08 oC to 23.3 oC. In Little Pine Creek, temperatures typically measured lower with temperatures ranging from 0.04 oC to 18.9 oC. than in other sites. Diurnal temperature changes are observable at each site as well but are not shown in the long-term temperature graphic.

Dissolved Oxygen
DO is the dissolved gaseous form of oxygen. It is essential for respiration of fish and other aquatic organisms. Fish need water to possess a DO concentration of at least 3-5 mg/L of DO. Coldwater fish such as trout generally require higher concentrations of DO than warmwater fish such as bass or bluegill. The IAC sets minimum DO concentrations at 5 mg/L for warmwater fish. DO enters water by diffusion from the atmosphere and as a byproduct of photosynthesis by algae and plants. Excessive algae growth can over-saturate (greater than 100% saturation) the water with DO. Waterbodies with large populations of algae and plants (macrophytes) often exhibit supersaturation due to the high levels of photosynthesis. Dissolved oxygen is consumed by respiration of aquatic organisms, such as fish, and during bacterial decomposition of plant and animal matter.
Dissolved oxygen concentrations display seasonal changes like those observed for temperature. Dissolved oxygen concentrations are opposite those measured for temperature. This is as expected as colder water holds more dissolved oxygen than warmer water; therefore, when water temperatures are low, dissolved oxygen concentrations are high and vice-versa. Little Wea Creek dissolved oxygen concentrations generally follow seasonal patterns; however, high productivity and large volumes of decomposition from flocculent sediments suggest that dissolved oxygen concentrations are completely utilized during spring and summer 2010 sample collection. All three streams display daily variation in dissolved oxygen concentration due to individual conditions present within each system.

pH
The pH of stream water describes the concentration of acidic ions (specifically H+) present in the water. The pH also determines the form, solubility, and toxicity of a wide range of other aqueous compounds. The IAC establishes a range of 6-9 pH units for the protection of aquatic life.
Throughout the sampling period, pH remained in an acceptable range in all three streams. No discernable pattern can be found in pH levels in any of the three monitored streams. Although fluctuations appear to be wide, pH levels varied within 1 unit of pH.
Turbidity
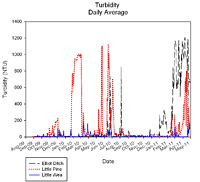
Turbidity (measured in Nephelometric Turbidity Units or NTUs) is a measure of water coloration and particles suspended in the water itself. It is generally related to suspended and colloidal matter such as clay, silt, finely divided organic and inorganic matter, plankton, and other microscopic organisms. According to the Hoosier Riverwatch, the average turbidity of an Indiana stream is 11 NTU with a typical range of 4.5-17.5 NTU. Turbidity measurements >20 NTU have been found to cause undesirable changes in aquatic life (Walker, 1978). The U.S. Environmental Protection Agency developed recommended water quality criteria as part work to establish numeric criteria for nutrients on an ecoregion basis. Recommended turbidity concentrations for this ecoregion are 9.89 NTUs (USEPA, 2000).
Turbidity concentrations exceeded the target 17% of the time in Little Wea Creek. In Little Wea Creek, turbidity measurements peaked at 632 NTU or more than 10 times the target turbidity concentration. In Little Wea Creek, turbidity concentrations measured as high as 1,217 NTU or nearly 70 times the target. Turbidity tends to spike during high flow events.
Conductivity
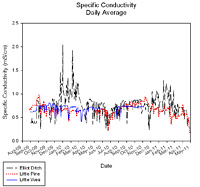
Conductivity is a measure of the ability of an aqueous solution to carry an electric current. This ability depends on the presence of ions: on their total concentration, mobility, and valence (APHA, 1998). During low flows, conductivity is higher than it is following a storm water runoff because the water moves more slowly across or through ion containing soils and substrates during base flow conditions. Carbonates and other charged particles (ions) dissolve into the slow-moving water, thereby increasing conductivity levels.
Conductivity measurements varied greatly over the sampling period. Generally, conductivity concentrations were below the state standard.

Nitrate-nitrogen
Nitrogen is an essential plant nutrient found in fertilizers, human and animal wastes, yard waste, and the air. About 80% of the air we breathe is nitrogen gas. Nitrogen gas diffuses into water where it can be “fixed”, or converted, by blue-green algae to ammonia for their use. Nitrogen can also enter lakes and streams as inorganic nitrogen and ammonia. Because of this, there is an abundant supply of available nitrogen to aquatic systems. The three common forms of nitrogen are:
Nitrate-nitrogen (NO3-N) Nitrate is an oxidized form of dissolved nitrogen that is converted to ammonia by algae. It is found is streams and runoff when dissolved oxygen is present, usually in the surface waters. Ammonia applied to farmland is rapidly oxidized or converted to nitrate and usually enters surface and groundwater as nitrate. The Ohio EPA (1999) found that the median nitrate-nitrogen concentration in wadeable streams classified as warmwater habitat (WWH) was 1.0 mg/l. Warmwater habitat refers to those streams which possess minor modifications and little human influence. These streams typically support communities with healthy, diverse warmwater fauna. The Ohio EPA (1999) found that the median nitrate-nitrogen concentration in wadeable streams classified as modified warmwater habitat (MWH) was 1.6 mg/1. Modified warmwater habitat was defined as: the aquatic life use assigned to streams that have irretrievable, extensive, man-induced modification that precludes attainment of the warmwater habitat use designation; such streams are characterized by species that are tolerant of poor chemical quality (fluctuating dissolved oxygen) and habitat conditions (siltation, habitat amplification) that often occur in modified streams (Ohio EPA, 1999). The U.S. Environmental Protection Agency developed recommended nitrate-nitrogen criterion as part of work to establish numeric criteria for nutrients on an ecoregion basis. The recommended nitrate-nitrogen concentration for the ecoregion is 0.63 mg/l (USEPA, 2000). Nitrate-nitrogen concentrations exceeding 10 mg/1 in drinking water are considered hazardous to human health (Indiana Administrative Code IAC 2-1-6).
Nitrate-nitrogen concentrations in Little Wea Creek mimic flow conditions with higher concentrations typically occurring during periods of higher flow. Nitrate-nitrogen concentrations in Little Wea Creek do not measure as high as those measured in Little Pine Creek (15 mg/L); however, like Little Pine Creek, concentrations in Little Wea Creek more often measure above the target concentration than below with most exceedances occurring during typical periods of manure application. In Little Wea Creek, nitrate-nitrogen concentrations exceed target concentrations 83% of samples during the sampling period.

Total Phosphorus
Phosphorus is an essential plant nutrient and the one that most often controls aquatic plant (algae and macrophyte) growth. It is found in fertilizers, human and animal wastes, and in yard waste. There are few natural sources of phosphorus to streams other than that which is attached to soil particles; there is no atmospheric (vapor) form of phosphorus. For this reason, phosphorus is often a limiting nutrient in aquatic systems. This means that the relative scarcity of phosphorus may limit the ultimate growth and production of algae and rooted aquatic plants. Management efforts often focus on reducing phosphorus inputs to receiving waterways because: (a) it can be managed and (b) reducing phosphorus can reduce algae production. Two common forms of phosphorus are:
Total phosphorus (TP) includes dissolved and particulate phosphorus. TP concentrations greater than 0.03 mg/1 (or 30μg/L) can cause algal blooms in lake systems. In stream systems, Dodd et al., 1998 suggests that streams with a total phosphorus concentration greater than 0.075 mg/L are typically characterized as productive or eutrophic. TP is often a problem in agricultural watersheds because TP concentrations required for eutrophication control are as much as an order of magnitude lower than those typically measured in soils used to grow crops (0.2-0.3 mg/L). The Ohio EPA (1999) found that the median TP concentration in wadeable streams that support WWM for fish was 0.10 mg/L, while wadeable streams that support MWH for fish was 0.28 mg/L. The U.S. Environmental Protection Agency recommended TP criterion for this ecoregion is 0.076 mg/L (USEPA, 2000).
In Little Wea Creek, total phosphorus concentrations exceed target concentrations 13% of samples during the sampling period. Peaks in total phosphorus concentration do not coincide with peak flow conditions within Little Wea Creek. Three peak concentrations were measured during the summers of 2009 and 2010 with peaks measuring near an order of magnitude higher than the target concentrations. Unlike peaks in Little Pine Creek, peak total phosphorus concentrations in Little Wea Creek typically occurred during one sampling event with concentrations quickly returning to more typical concentrations.

Total Suspended Solids
A TSS measurement quantifies all particles suspended in stream water. Closely related to turbidity, this parameter quantifies sediment particles and other solid compounds typically found in stream water. In general, the concentration of suspended solids is greater during high flow events due to increased overland flow. The increased overland flow erodes and carries more soil and other particulates to the stream. The State of Indiana does not have a TSS standard. In general, TSS concentrations greater than 80 mg/L have been found to be deleterious to aquatic life; concentrations of 15 mg/L are often targeted as levels necessary for quality fishery production (Waters, 1995).
Total suspended solids concentrations typically measured below the target concentration within Little Wea Creek. In Little Wea Creek, total suspended solids concentrations exceed target concentrations 20% of samples during the sampling period. The few peak TSS concentrations measured in Little Wea Creek were the highest concentrations measured exceeding 350 mg/L. TSS concentration typically measured in Little Wea Creek suggest that targeting sediment moved during high flow or storm conditions will result in decreased TSS concentrations.

E. coli
E. coli is one member of a group of bacteria that comprise the fecal coliform bacteria and is used as an indicator organism to identify the potential presence of pathogenic organisms in a water sample. Pathogenic organisms can present a threat to human health by causing a variety of serious diseases, including infectious hepatitis, typhoid, gastroenteritis, and other gastrointestinal illnesses. E. coli can come from the feces of any warm-blooded animal. Wildlife, livestock, and/or domestic animal defecation, manure fertilizers, previously contaminated sediments, and failing or improperly sited septic systems are common sources of the bacteria. The IAC sets the maximum standard at 235 colonies/100 ml in any one sample within a 30-day period.
In Little Wea Creek, E. coli concentrations exceed target concentrations 50% of samples during the sampling period. Peak E. coli concentrations within all three tributaries measure approximately 10,000 colonies/100 mL, suggesting that high E. coli concentrations are typical within these systems.